 B2BROKER
 B2CORE
 B2CORE IB
 B2TRADER
 B2CONNECT
 B2TRANSLATE
 B2BROKER
How to integrate Amplitude
Learn how to integrate Amplitude with B2CORE to track events and gain powerful analytics
Amplitude is an event-based analytics platform that can be configured to receive data about client activity in the B2CORE UI, iOS, and Android apps. It provides insights into engagement, retention, and financial results, helping you evaluate performance and improve your services.
Key concepts in Amplitude
In Amplitude, events represent actions that clients perform in B2CORE, such as sign-ups, sign-ins, deposits, withdrawals, wallet creation, and many others. Each event may include event properties (for example, platform name, amount, currency, or others) which provide context for deeper analysis. By tracking events, you can better understand client behavior and evaluate how they interact with the B2CORE UI, iOS, and Android apps.
Default Amplitude Events
Amplitude provides a set of default events, such as Start Session, End Session, and others. These events are marked with the Amplitude logo.
B2CORE-specific events
B2CORE offers a set of pre-defined events, such as Deposit page clicked, Deposit submitted, Verification started, Verification submitted, Wallet created, Feedback, and others. These events start tracking automatically once Amplitude is connected to your B2CORE. The full list of B2CORE-specific events available for tracking is provided in the document Tracking B2CORE Events with Amplitude, which can be requested via your account manager.
Sign up for Amplitude
Sign up for Amplitude on your own by following the official Amplitude documentation. You can start with the free version. If you have any questions, contact their support team.
Create a project and sources in Amplitude
You should create an account for your organization in Amplitude, then create a project and add sources that represent the origin of the data sent to Amplitude (for example, iOS, Android, Web, or Backend).
Sources are added using the appropriate Amplitude SDK for each platform.
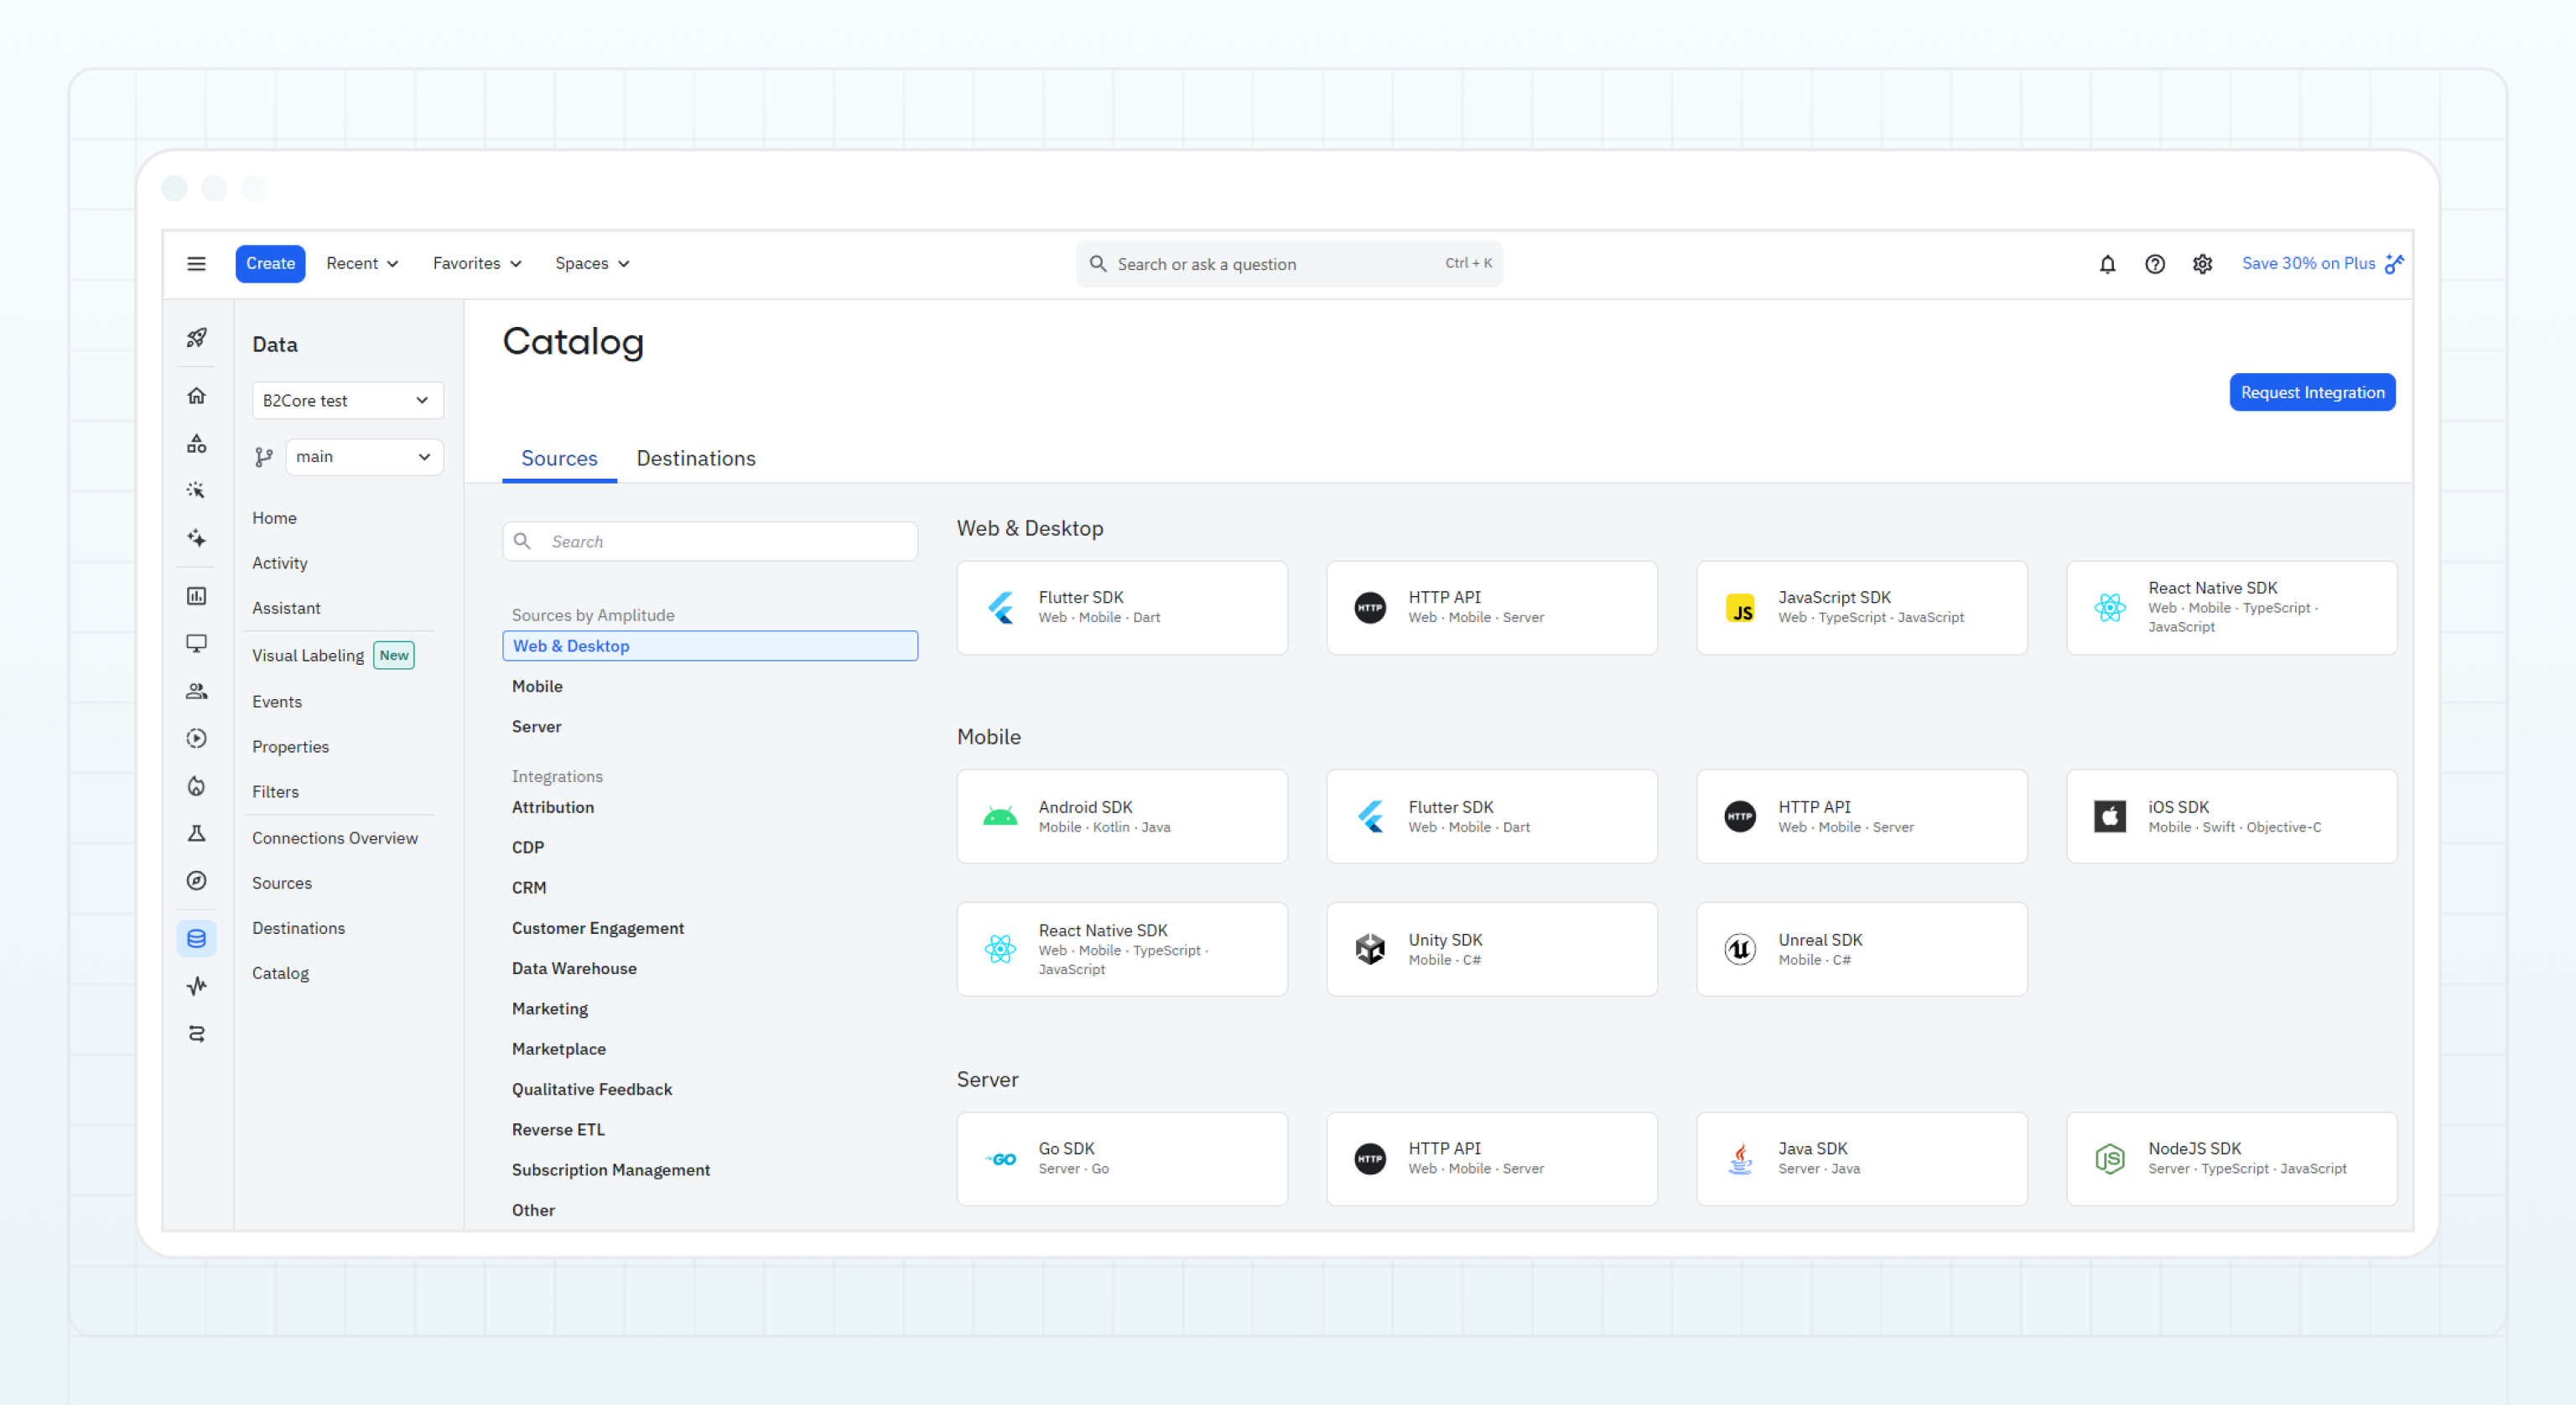
After adding sources, share the generated API keys with B2BROKER so we can complete the SDK setup for you. This setup enables event data from your B2CORE to be sent to Amplitude.
Check incoming events for Amplitude tracking
Once sources are configured and your Amplitude project starts receiving data from B2CORE, all received events are collected in Data > Events, along with their event properties in Data > Properties.
You must verify incoming events with the Unexpected status against the documented events in Tracking B2CORE Events with Amplitude to understand their meaning and either add the events that you want to track to your Amplitude plan or delete the ones you don't need.
It's recommended to perform event verification carefully, taking into account your Amplitude plan limits. Some events, such as Page viewed, occur very frequently (for example, on every page load) and may quickly consume the monthly event quota, potentially exceeding your Amplitude plan.
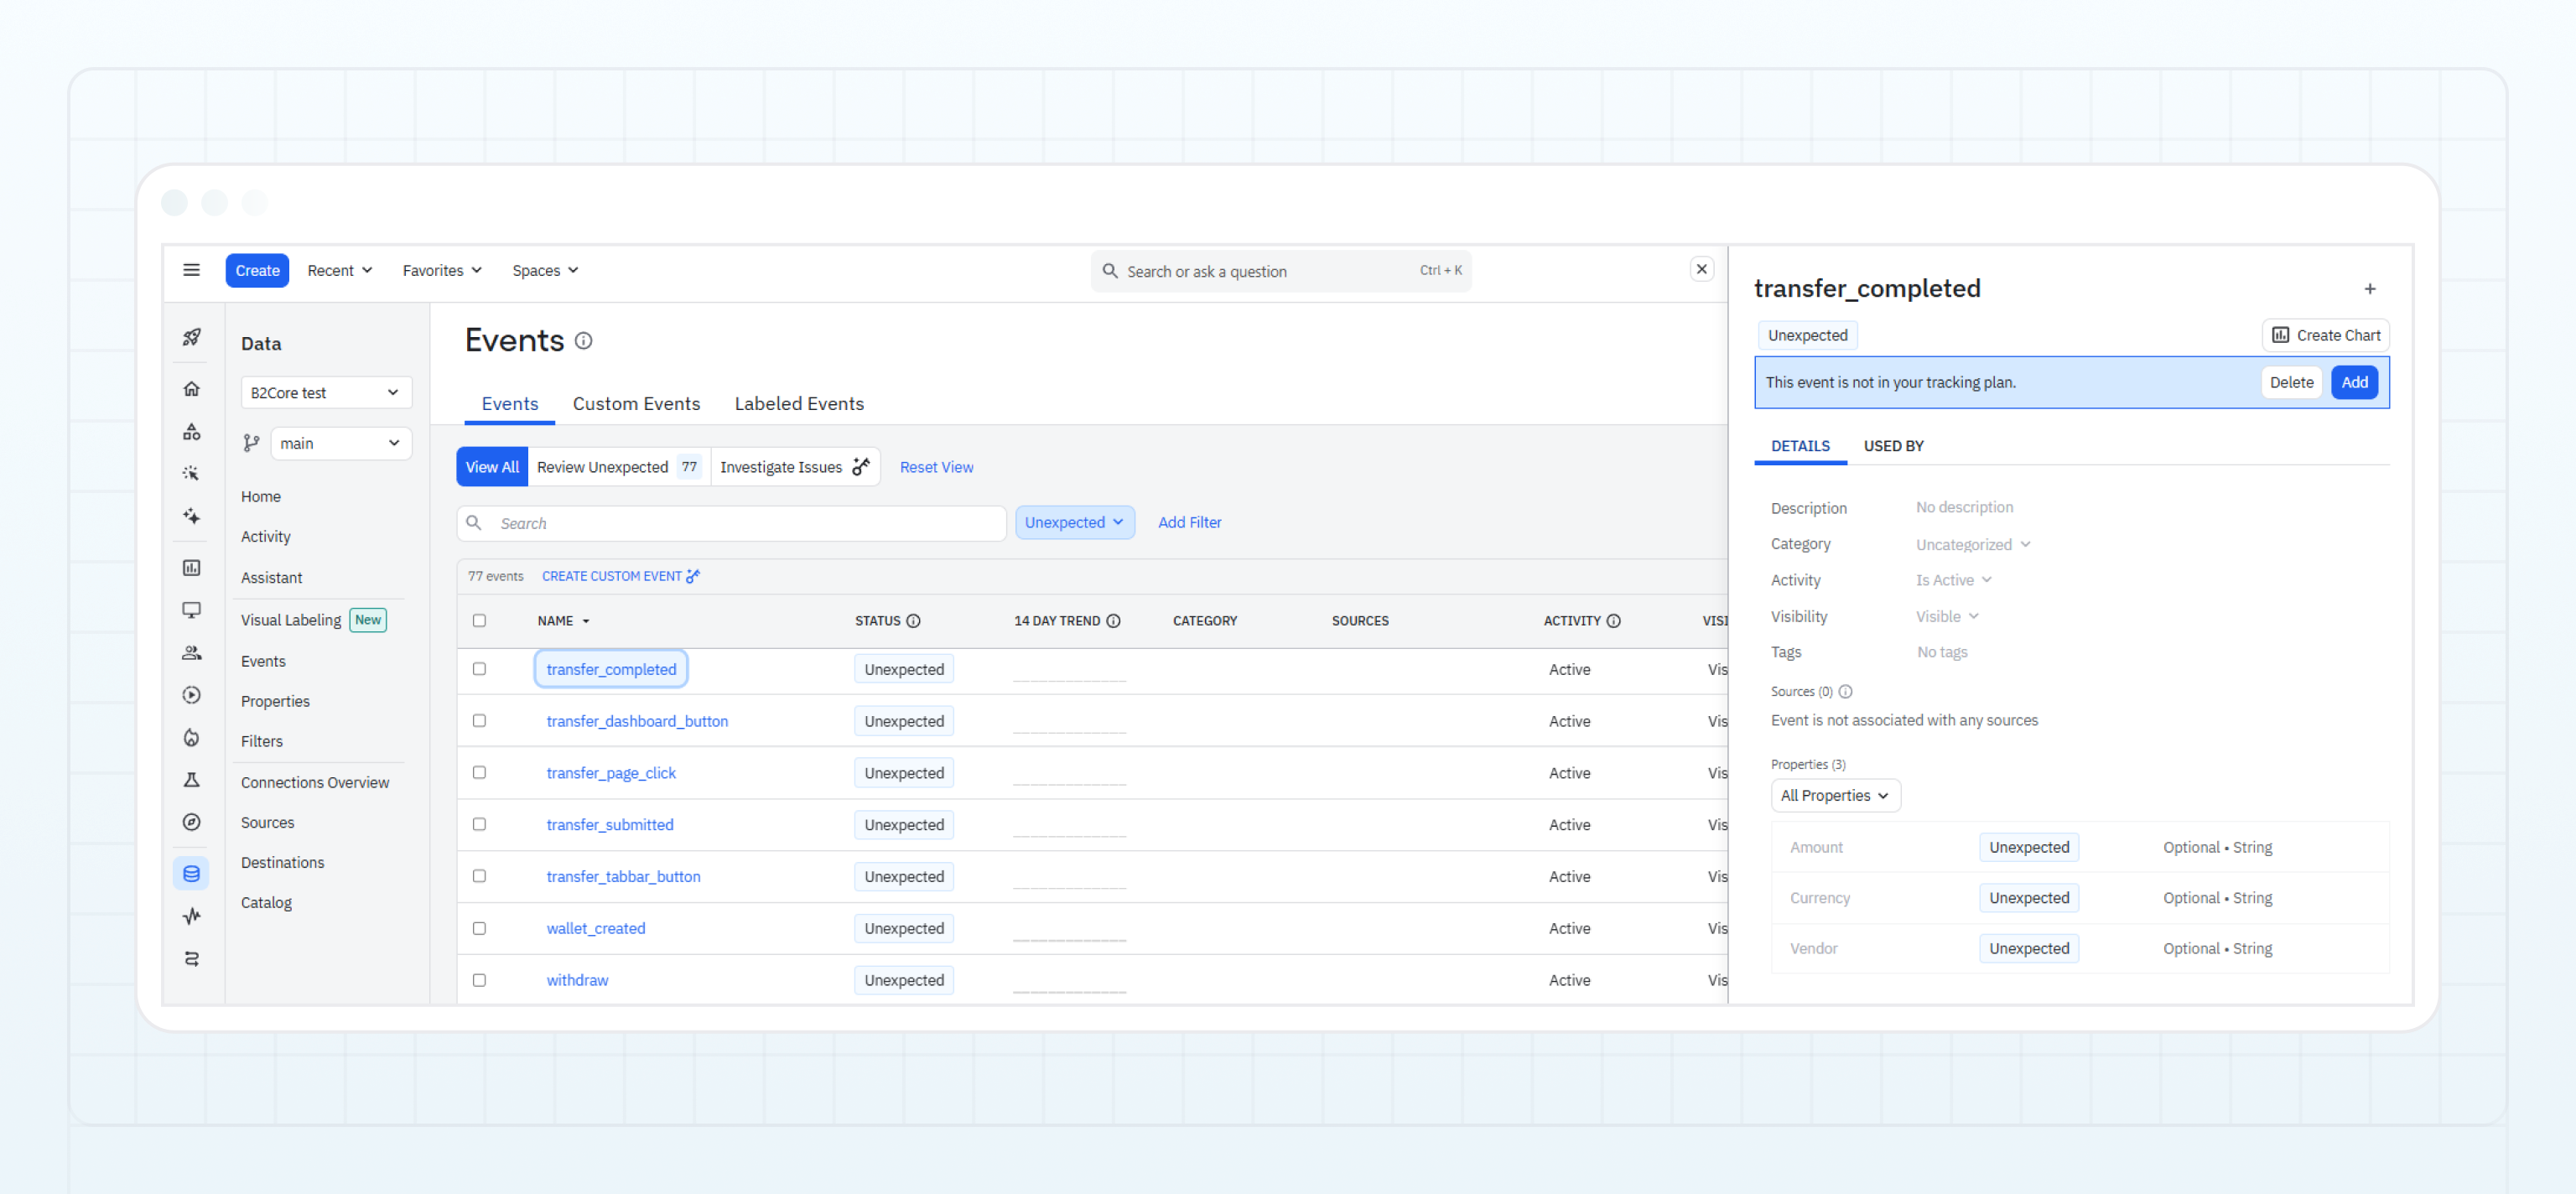
Events included in your Amplitude tracking plan are marked as Live and begin tracked in real time.
Configure data representation in Amplitude
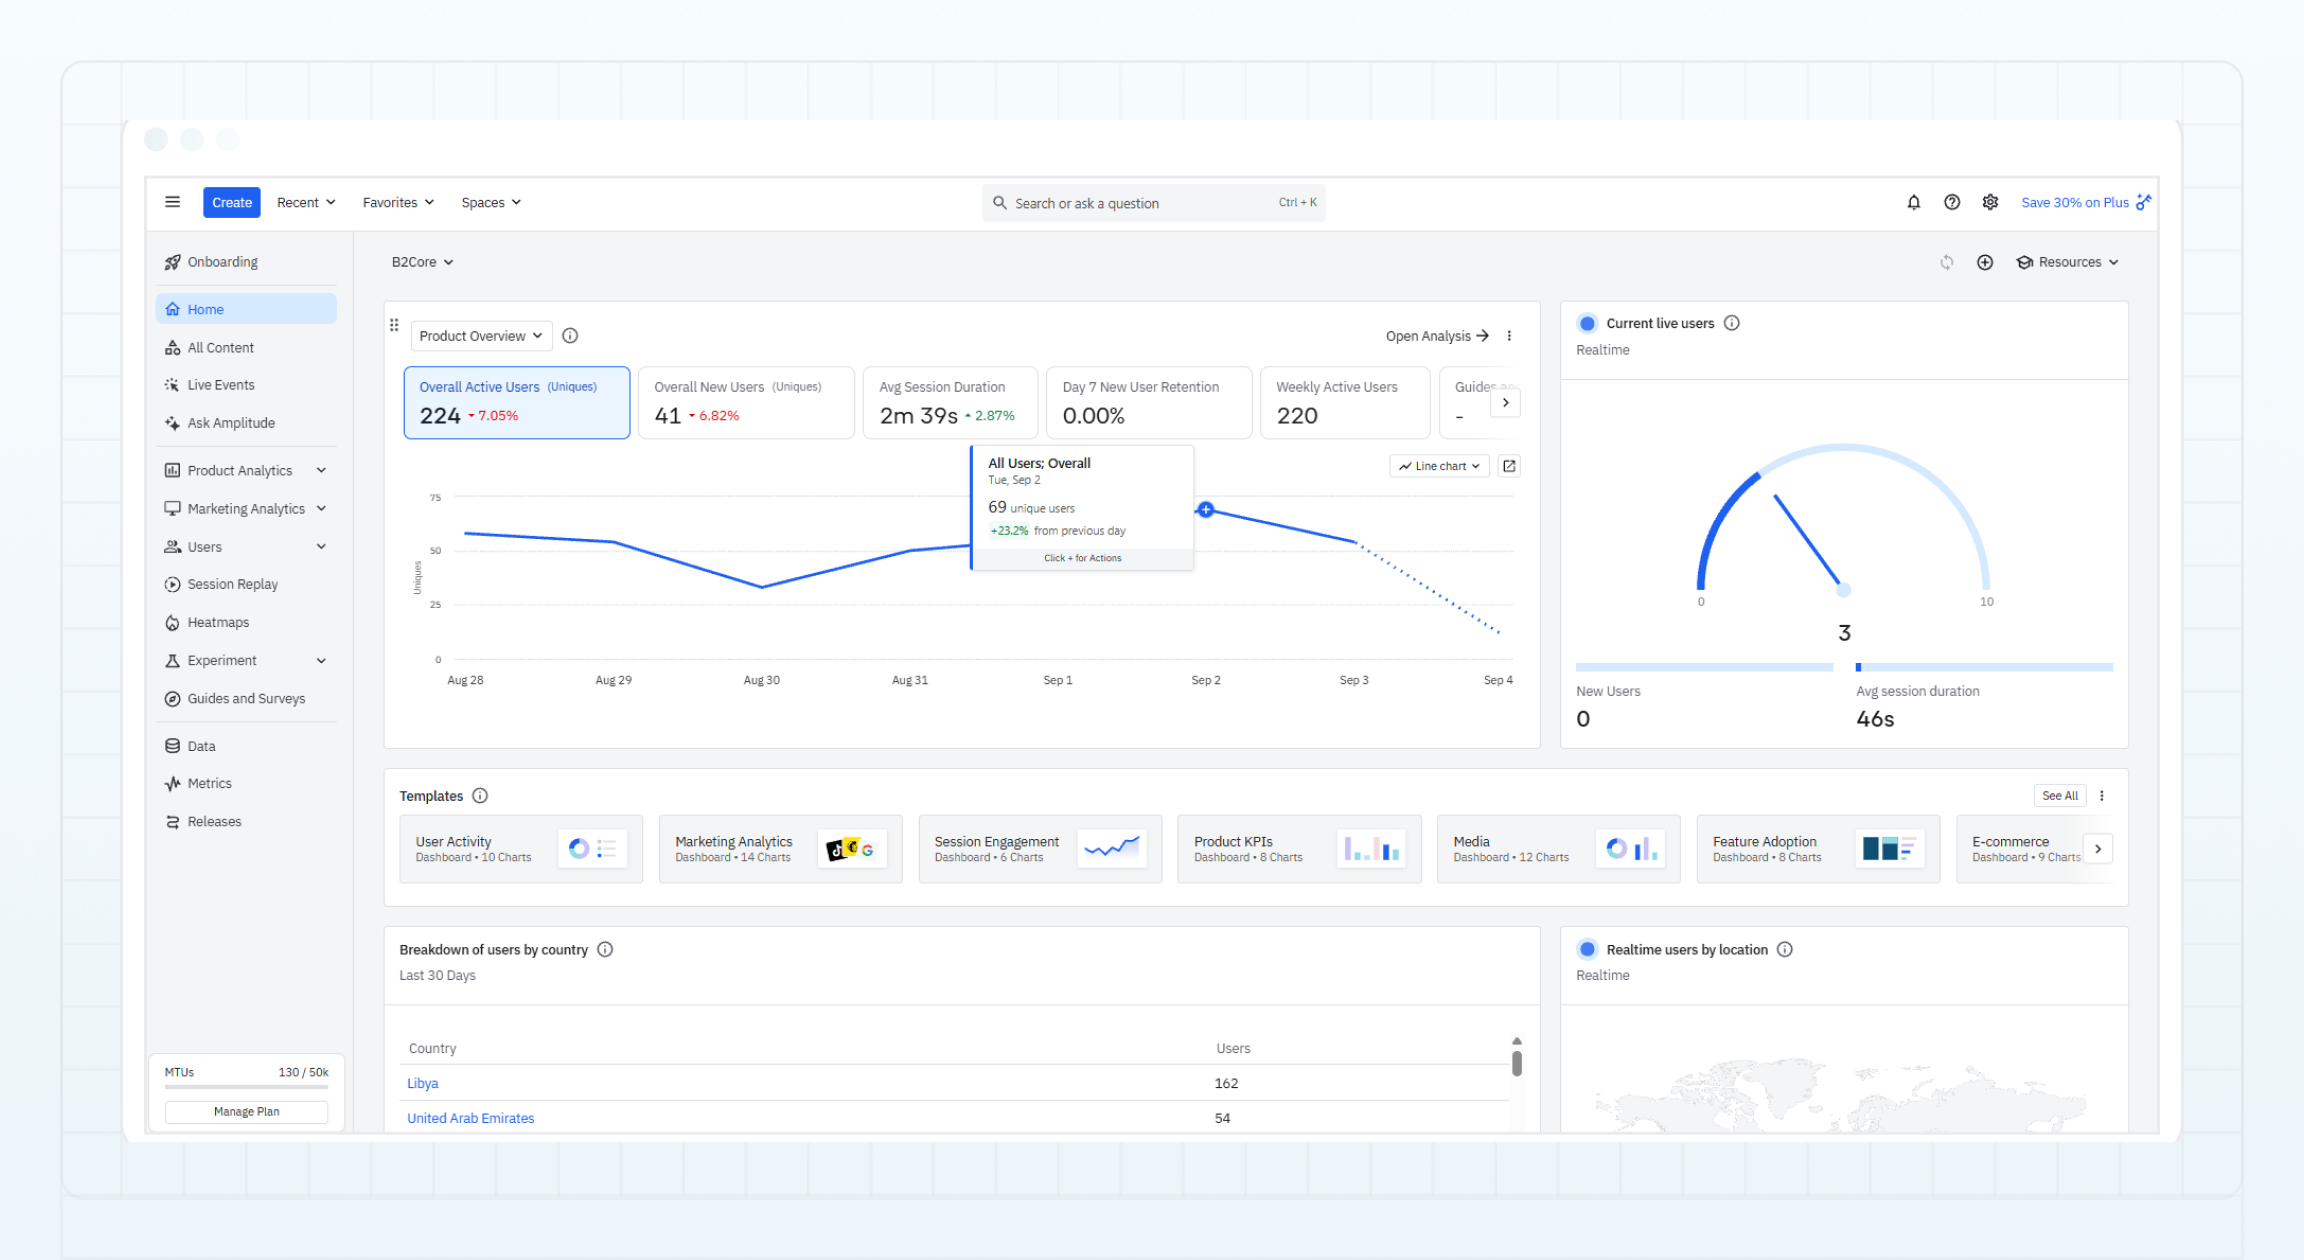
In your Amplitude project, access the Dashboard on the Home page. By default, it includes a set of pre-defined widgets with collected data from the default Amplitude events. You can fully customize the Dashboard to display the information and charts that are most relevant to you.
Build charts in Amplitude
Charts in Amplitude turn raw event data into visual insights about how clients interact with B2CORE. Each chart is based on the events you track, enabling you to monitor engagement, conversion, retention, and user distribution. This makes it easier to understand client behavior and improve your services.
To create a chart, click Create > Charts and select the desired chart type.
For more details on working with charts, see the official Amplitude documentation.
Below are several examples of simple charts that you can build in Amplitude. You can add charts to your Dashboard, share them, and export data if needed.
Segmentation chart
The Segmentation chart compares or segments your events by event properties over a selected time period.
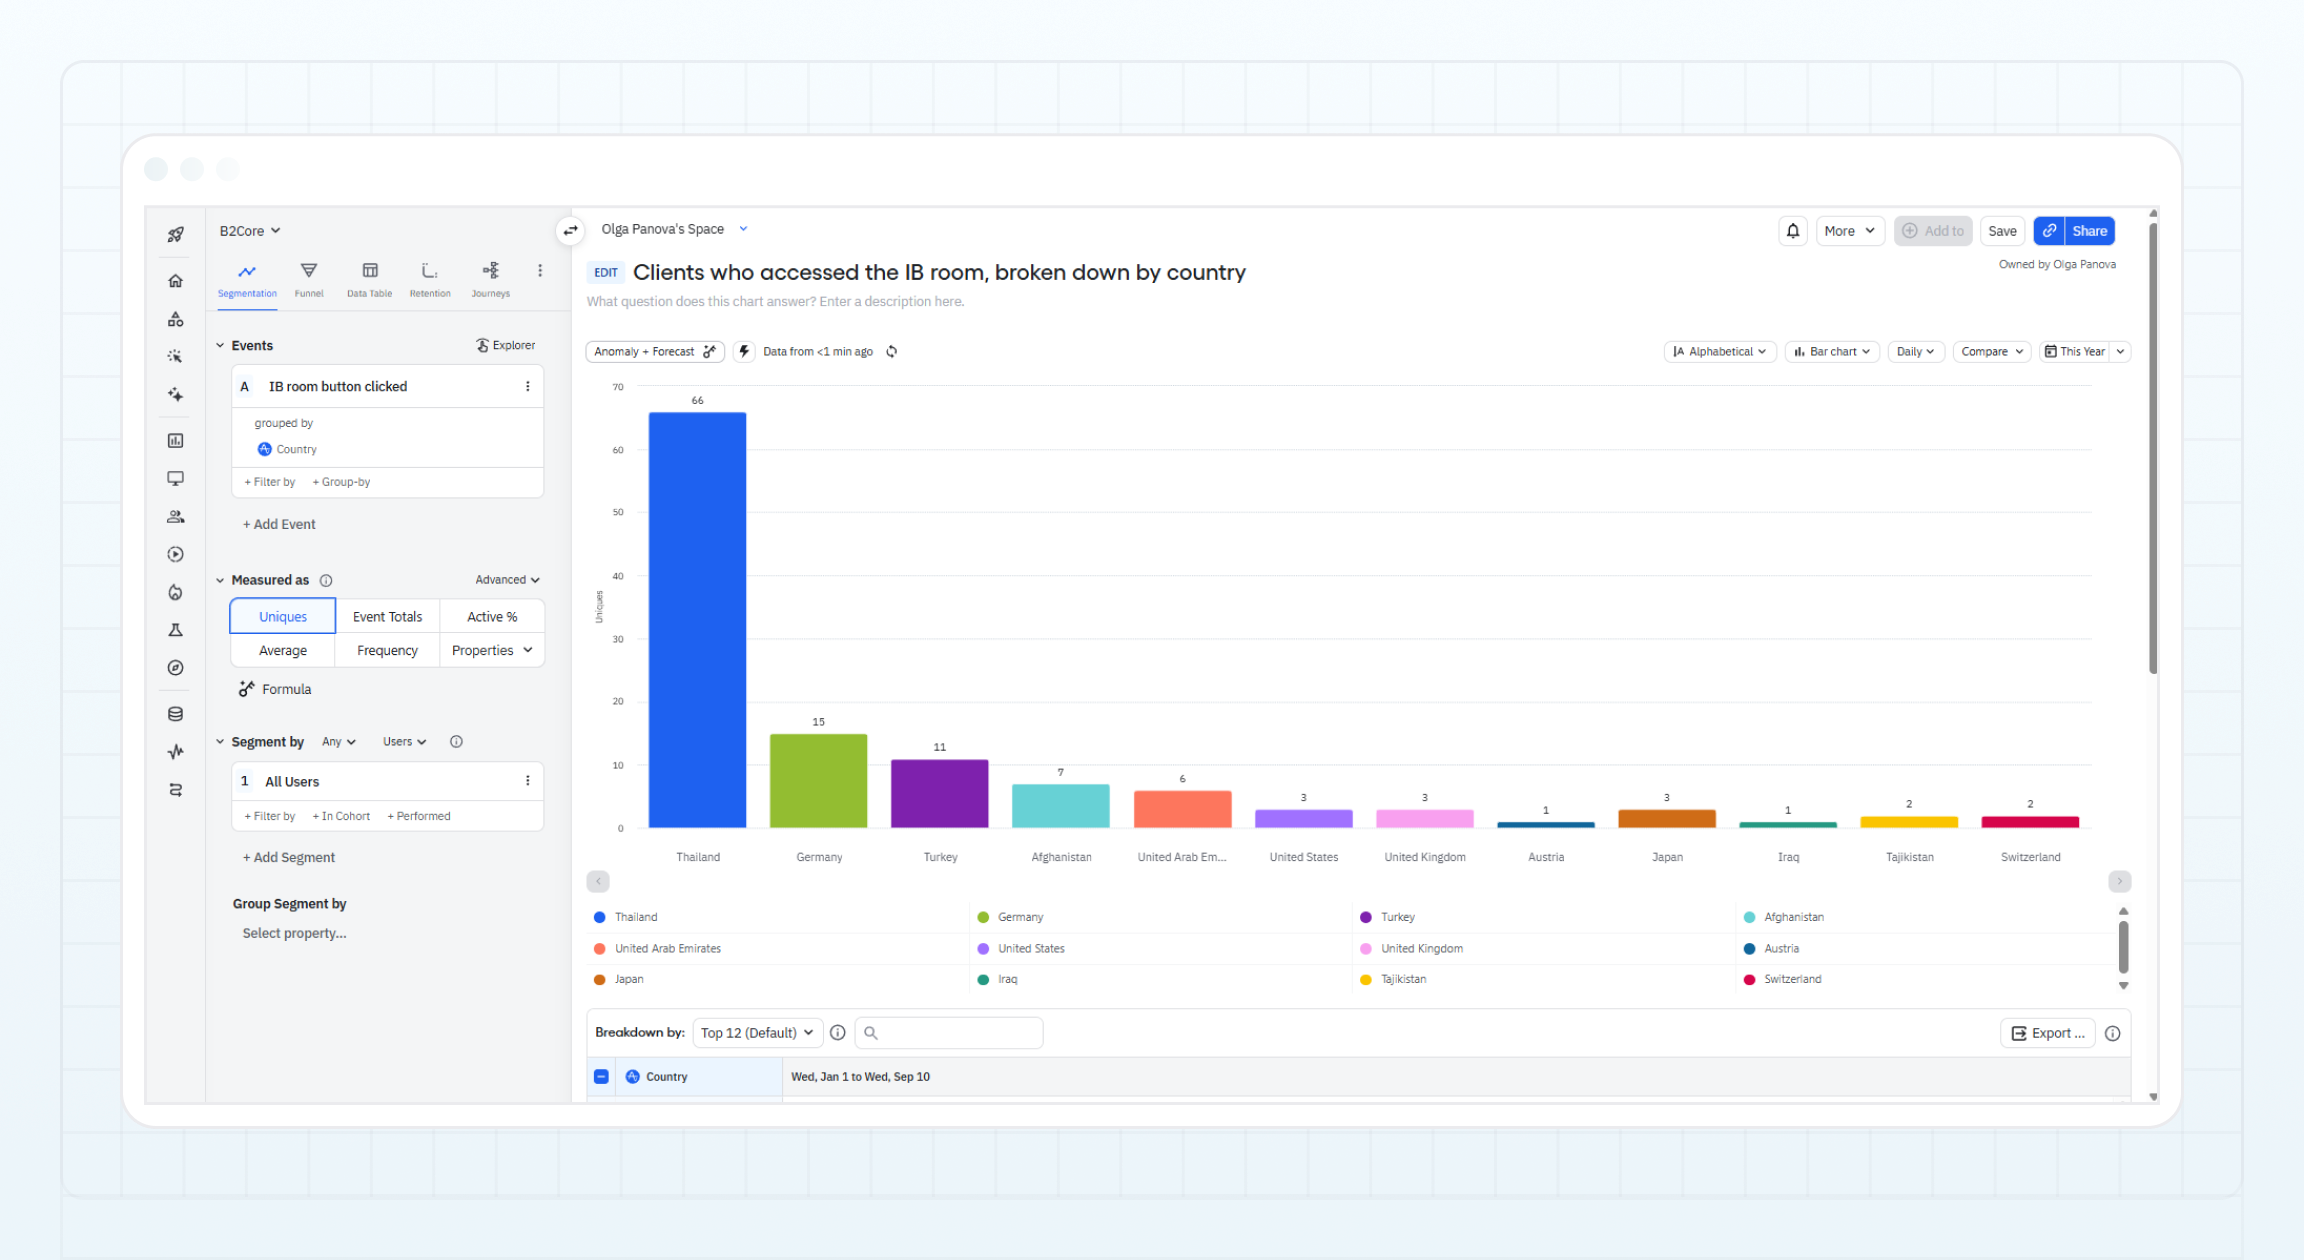
The chart above shows the number of unique clients who accessed the IB room over the past year, broken down by country.
Funnel chart
The Funnel chart helps you understand how clients navigate within the UI and identify potential problem areas where they tend to drop off. A common example of a funnel is analyzing sign-ups and onboarding.
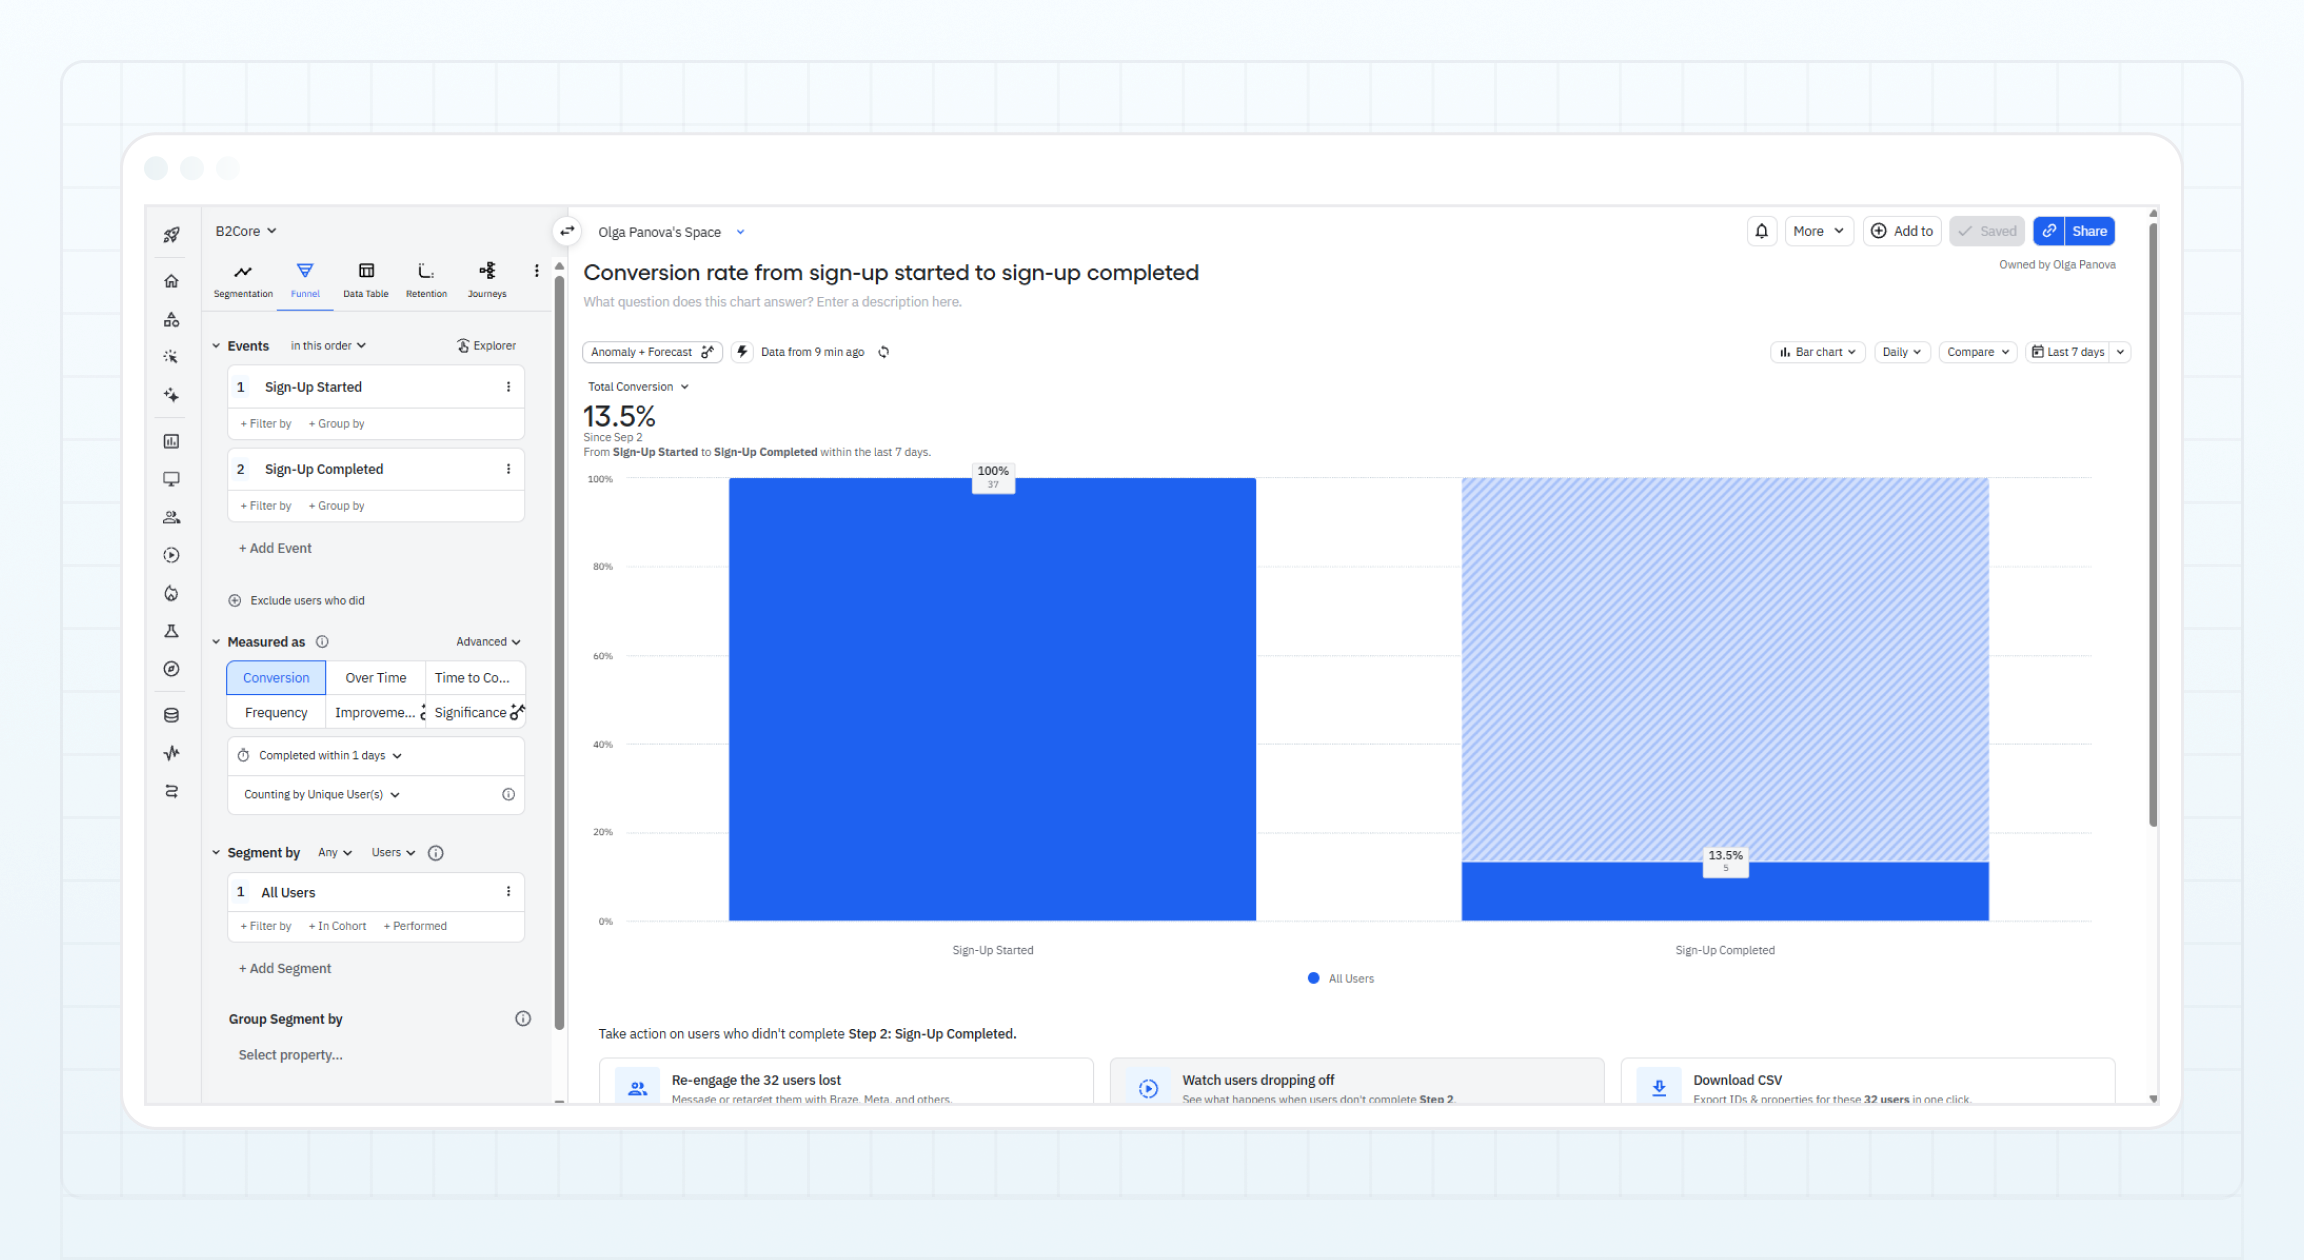
The chart above shows the conversion rate from clients who started registration to those who completed it over the past 7 days.
User composition
The User Composition chart provides insights into the structure of your client base. Unlike event-driven analyses, this chart relies on user properties, such as country, language, platform, or account type, rather than client actions.
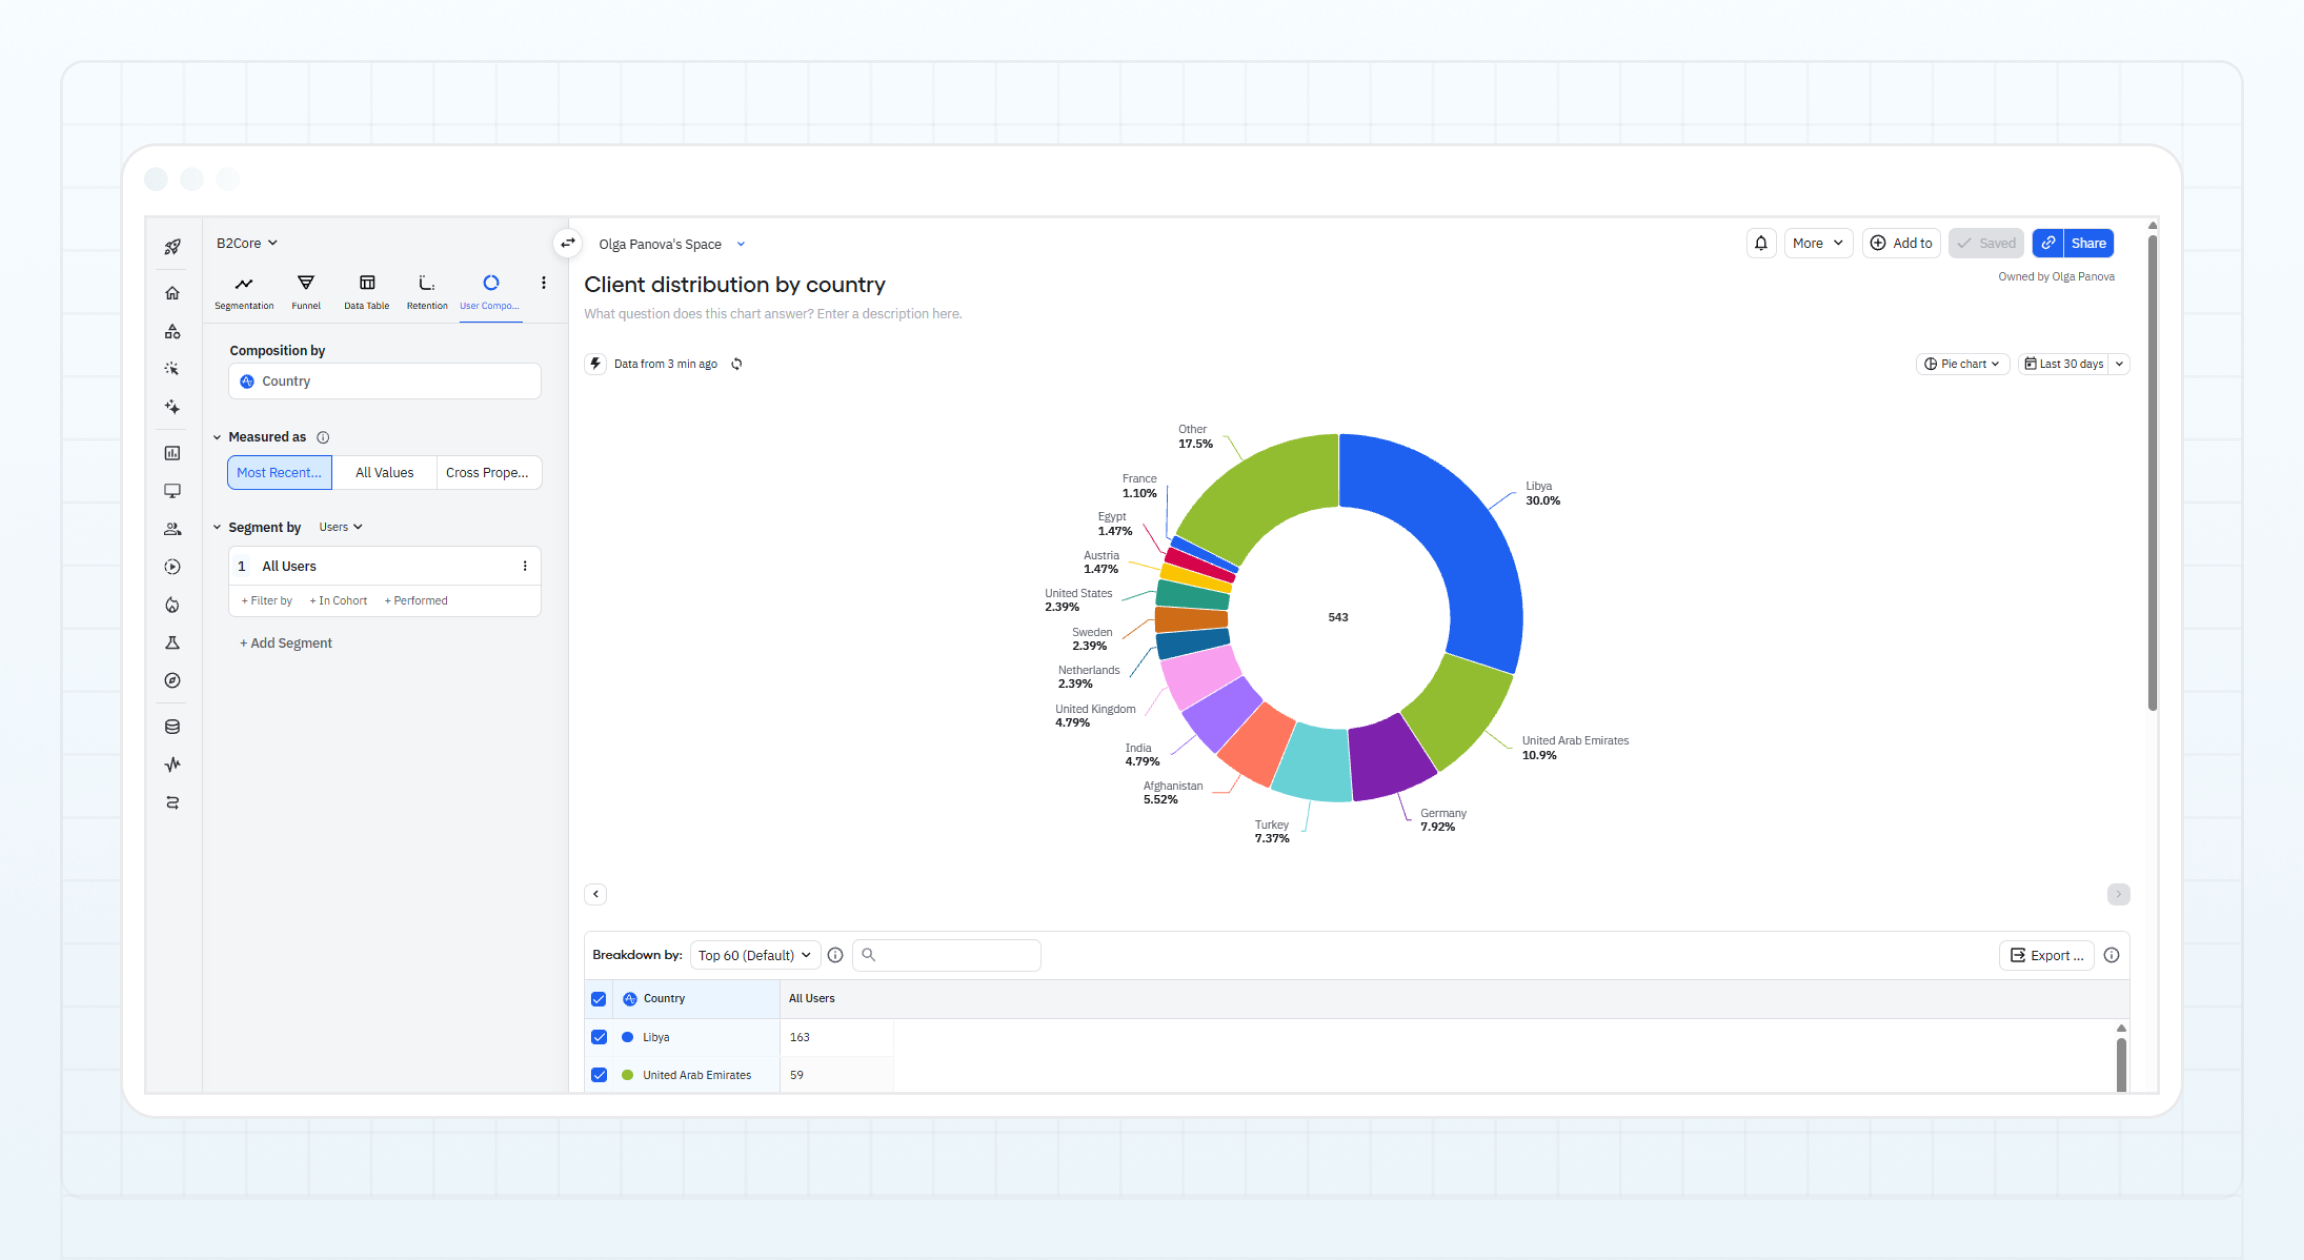
The chart above shows the distribution of registered clients across different countries, helping you understand where your clients come from and how your client base is organized.
Last updated on