 B2BROKER
 B2CORE
 B2CORE IB
 B2TRADER
 B2CONNECT
 B2TRANSLATE
 B2BROKER
Dashboard
Explore key financial metrics, including deposits, withdrawals, and net deposits on the Back Office Dashboard
The Dashboard page provides a quick overview of key financial metrics over the selected period, helping you analyze the overall performance and financial activity.
Access to the Dashboard
The Dashboard is available to users who are assigned the permission Access to Finance Dashboard under the Statistics category and opens after signing in to the Back Office. For other Back Office users, the Dashboard is hidden, and they are redirected to the Clients > General page after signing in.
For more details about user groups and permissions, refer to How to add a user group and grant permissions.
By default, the financial metrics are displayed for the current day. You can select one of the following periods:
- Today
- Yesterday
- Last 7 days
- Last 30 days
- Last 90 days
- This month
- Last month
- Custom range
You can also filter the displayed metrics by using the following filters located above the metric blocks:
- Client Type
- Jurisdiction
- Country
- Manager
- Client Tags
To reset the selected filters and period, click the Reset button.
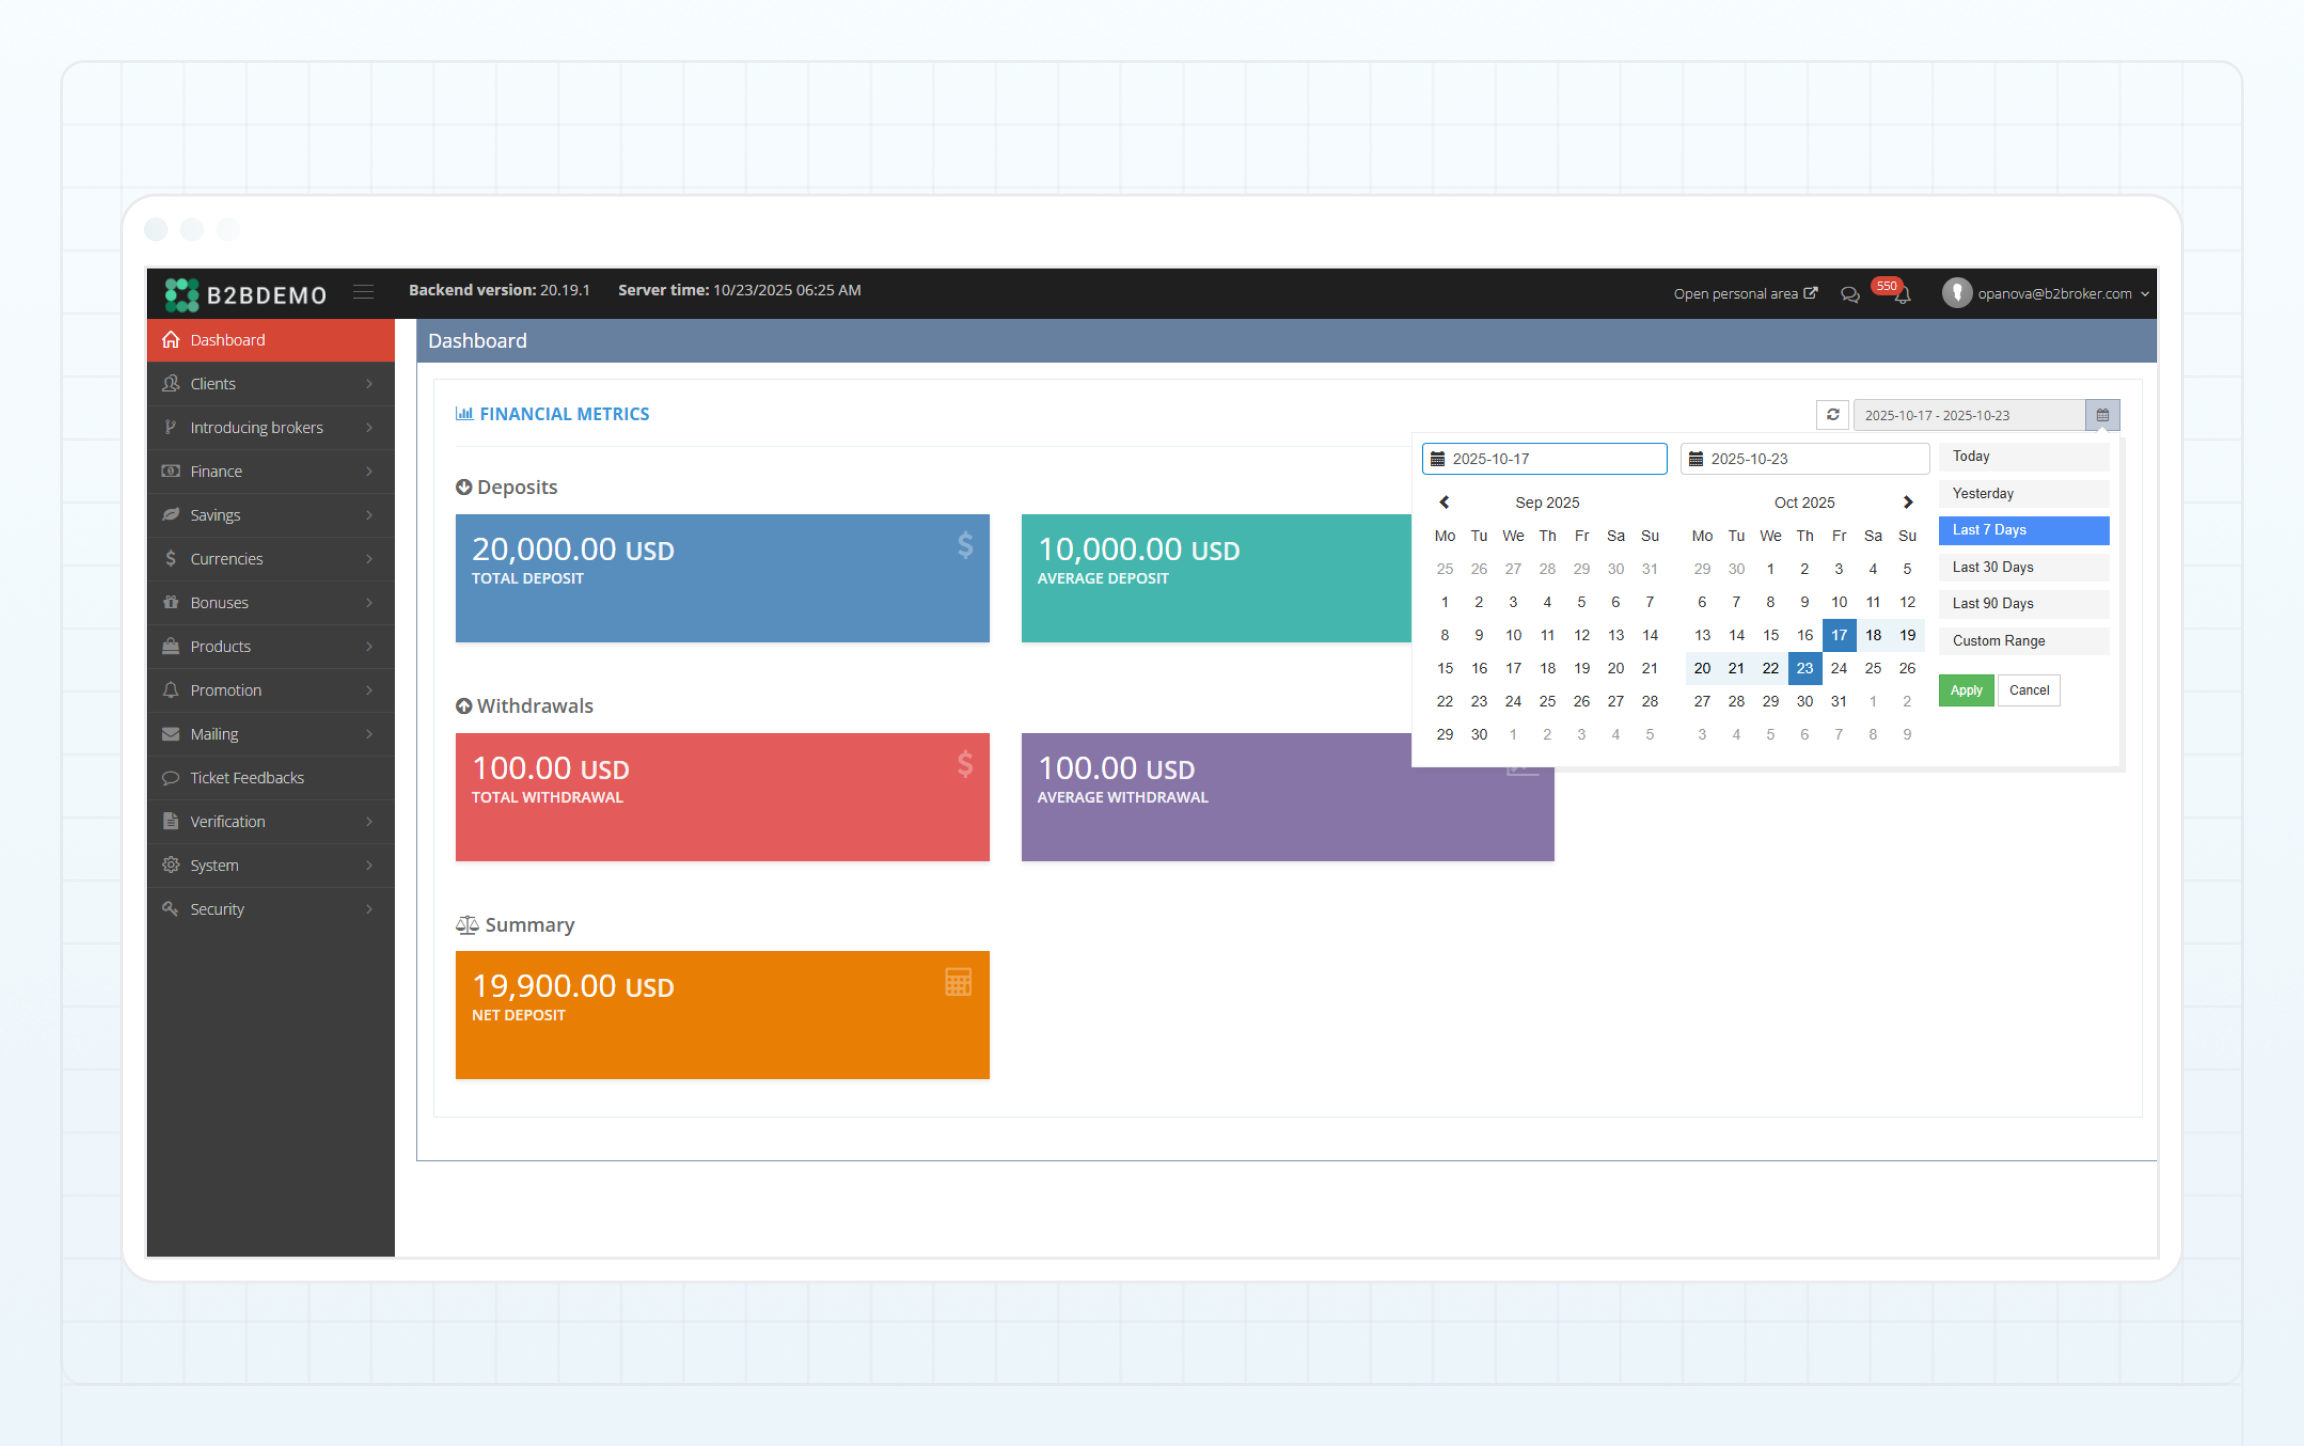
The following information is displayed on the Dashboard:
Deposits
-
Total deposit — the total amount of deposits, in USD, for the selected period. The metric is calculated against the Final amount (USD) column in Finance > Deposits. Only the completed deposits in the final status are included.
-
Average deposit — the average deposit amount for the selected period, which is calculated as:
Total deposit / Number of deposits
Withdrawals
-
Total withdrawal — the total amount of withdrawal, in USD, over the selected period. The metric is calculated against the Final amount (USD) column in Finance > Payouts. Only the completed withdrawals in the final status are included.
-
Average withdrawal — the average deposit amount for the selected period, which is calculated as:
Total withdrawal / Number of withdrawals
Summary
-
Net deposit — the net amount of deposits, in USD, for the selected period, calculated as:
Total deposit − Total withdrawal
Last updated on